
Results of Online Usability Study Comparing Obama and McCain Websites
by Tom Tullis
Originally posted November 9, 2008

|
Results of Online Usability Study Comparing Obama and McCain Websitesby Tom Tullis |
|
|
Table of Contents |
A quick online usability study of the Obama and McCain websites was conducted on November 3rd and 4th, 2008. Preparation for the study took about 2 hours and data analysis took about 4 hours. Participants were asked to do four tasks on one of the sites: find where to vote, find the candidate's position on Social Security, find a photo of the candidate waving, and find the impact of the candidate's tax plan on them. Participants were randomly assigned to one of the two sites; 44 of them completed the tasks. Task success (self-reported), task times, and task ease ratings were collected, as were ratings on several scales, including the System Usability Scale (SUS). Overall, the users were successful with 78% of their tasks on the Obama site but only 47% on the McCain site. Users of the McCain site also took 28% longer and rated the tasks as 27% more difficult. Users rated the Obama site as being significantly easier to find information on and significantly more visually appealing. And the Obama site received a mean SUS score of 76% compared to 45% for the McCain site. Usability issues with both sites were identified from user comments. Overall, it was a landslide usability victory for the Obama website.
On the eve of the recent Presidential Election, I decided it would be interesting to do a quick online usability study comparing the websites of the two major candidates:
(There's a good chance that both of those sites have changed, or even been taken down, since the election. Full screenshots of the home pages of both sites at the time of the study can be seen here: McCain site, Obama site.)
I did the study mainly to illustrate that an online study could be done quickly. I designed the study, deployed it, and sent an email message to friends and co-workers asking them to participate all within about 2 hours. That included choosing the tasks. That was on Nov. 3, the eve of the election. I collected data through 3:00 pm on Election Day (Nov. 4), analyzed it, and sent a summary of the results to the participants within 4 hours.
The online study itself can be seen here: http://www.webusabilitystudy.com/PresidentialCandidates/. Feel free to go through the study, although I don't plan to continue tabulating the data (and some of the tasks may no longer be possible on the sites).
When a potential participant went to the starting page, an overview of the study was presented. After the user entered a name and clicked on "Next", a set of instructions was shown. As explained in those instructions, when the user clicked on "Begin Study", two windows then opened, fitting the top and bottom of the screen:
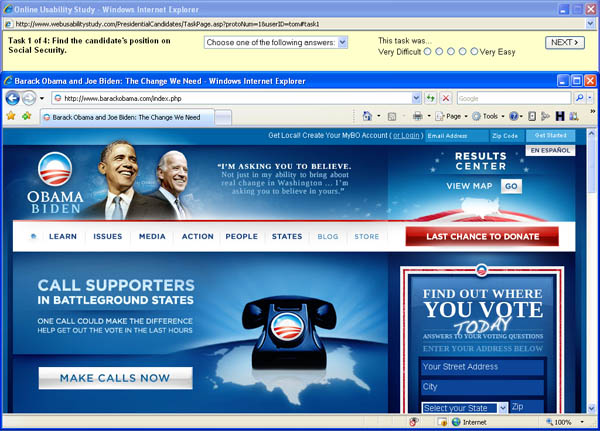
The top window presented the first task to be performed. The bottom window presented one of the two sites being evaluated. Each participant was randomly assigned to one site or the other and only used that site for the entire study. The users were free to use any of the features of the site. However, they were instructed not to use any other sites to find the answers (e.g., Google).
The drop-down menu of answer options was the same for each task:
Basically, the participants were self-reporting whether or not they had found the answer to the question. This technique was used for several reasons:
The user was required to select an answer in order to continue to the next task. The user was also asked to give a rating to the task on a 5-point scale from "Very Difficult" to "Very Easy", although this rating was not required:
![]()
Four tasks were used in the study:
The four tasks were presented in random order so that any practice effects would be distributed across the tasks.
I came up with a set of possible tasks before studying either site based on my own questions about the candidates. They at least seemed to me to be questions that visitors to these sites might be interested in. I then eliminated any tasks that I couldn't find some kind of answer to on both sites. I also wanted one factual question where it would be pretty unequivocal whether you had found the answer-- thus the task about finding a photo of the candidate waving.
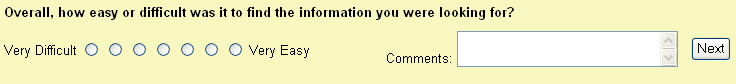
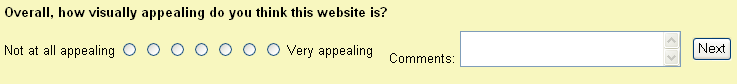
After all four tasks, the participant was asked to rate the site on two 7-point scales, each of which had an associated comment field:
This was followed by two open-ended questions:
The last part was an adaptation of the System Usability Scale (SUS), adapted for use in evaluating websites. The original version of SUS was developed by John Brooke while working at Digital Equipment Corporation in the UK in 1986. These rating scales were introduced with the instruction, "For each of the following statements, select the response that best describes your overall reactions to the website you used today." Each of the ten rating scales was presented by itself, with Previous & Next buttons to move between them, as in this example:

The exact wording of each of the ten statements was as follows:
Each statement was accompanied by a 5-point scale of "Strongly Disagree" to "Strongly Agree". Note that half of the statements are positive and half are negative, which is part of what seems to make SUS effective.
I sent an email message to a variety of co-workers and friends explaining what the study was about and including a link to participate. Note that the majority of the people who did the study are ones who live in the Boston area. Given the generally liberal leanings of Massachusetts, it's pretty safe to guess that more of the participants were in favor of Obama than McCain. (In the election, 62% of Massachusetts voted for Obama and 36% for McCain.) But the participants were randomly assigned to the two sites.
A total of 53 people entered a name on the first page and clicked on
"Next". Amazingly, the participants included Hillary Clinton, George
W. Bush, George Washington, and even Barack Obama himself! (The participants
got to choose their own names for the study.)
Of those, 44 (83%) completed the four tasks. This relatively low drop-off rate is probably due to the small number of tasks and general interest in the topic. Of those 44 participants, 25 were assigned to the Obama site and 19 to the McCain site. Finally, 37 participants (21 for Obama and 16 for McCain) completed the SUS survey at the end.
As the participants were completing their tasks, the time elapsed from the presentation of the task to their selection of an answer and clicking on the "Next" button was automatically recorded. Of course, their answer was also recorded, as were their responses to all the rating scales and open-ended questions. So the primary metrics captured were:
Overall, users of the Obama site reported that they found the answers for 78% of their tasks while users of the McCain site reported only 47% success, as shown here:
In all graphs, error bars represent a 90% confidence interval for the mean. In the case of task success, this was calculated using the Adjusted Wald Method. For three of the four tasks, significantly more users of the Obama site found their answers than did users of the McCain site. In the case of the photo of the candidate waving, significantly more users of the McCain site found the answer.
In calculating the times for each task, any individual task times longer than 420 seconds (7 minutes) were dropped due to the likelihood of the user having been interrupted. This resulted in only 2 task times being dropped (one for each site).
Overall, users of the Obama site had a mean time per task of 76 seconds while users of the McCain site had a mean time per task of 97 seconds, or about 21 seconds (28%) longer, as shown here:
For two of the tasks (Social Security & Tax Plan), users of the Obama site found their answers significantly faster. For the Photo task, users of the McCain site found their answer significantly faster. For one task (Where to Vote), there was not a significant difference, but there was a trend for the Obama users to have shorter times.
One way of measuring task efficiency is to calculate the percent correct per minute, thus combining the time and accuracy data. Overall, the users of the Obama site had an efficiency of 71% while the users of the McCain site had an efficiency of 41%, as shown here:

Overall, the users of the Obama site were significantly more efficient in finding their answers.
Participants also rated how easy or difficult each task was on a 5-point scale (Very Difficult ... Very Easy), with higher numbers better. The Obama site received a mean task ease rating of 3.7 while the McCain site received a mean rating of 2.7 (27% worse), as shown here:
The task ease ratings can also be analyzed by task:

Consistent with the task success and task time data, participants rated the Obama site significantly easier for three of the tasks (Where to Vote, Social Security, & Tax Plan) and the McCain site significantly easier for one task (Photo of Candidate).
After attempting their four tasks, the participants were asked to rate the site they had just used on two scales: Ease of Finding Information and Visual Appeal. Each rating was on a 7-point scale, with higher numbers better. Each rating scale also had an optional comments field.
The mean "Ease of Finding Information" rating was 5.4 for the Obama site and 3.0 for the McCain site, as shown here:
This difference was highly significant (p<.0001) by t-test.
You can also view the comments associated with this rating scale:
The mean "Visual Appeal" rating was 5.7 for the Obama site and 4.7 for the McCain site, as shown here:
This difference was significant (p<.05) by t-test.
You can also view the comments associated with this rating scale:
Next was an open-ended question asking the participant if there were any particularly challenging or frustrating aspects of the website tested. You can view the responses to that question:
For the Obama site, 57% of the participants (12 out of 21) indicated challenging or frustrating aspects; for the McCain site, 62% (10/16) indicated challenging or frustrating aspects.
The complaints about the Obama site given by at least two participants were:
The complaints about the McCain site given by at least two participants were:
Next was another open-ended question asking the participant if there were any particularly effective or intuitive aspects of the website tested. You can view the responses to that question:
For the Obama site, 76% of the participants (16/21) indicated effective or intuitive aspects; for the McCain site, 44% (7/16) indicated effective or intuitive aspects.
The effective or intuitive aspects about the Obama site given by at least two participants were:
There were no clear cases with the McCain site where two people identified the same effective or intuitive aspect, although two comments about the "navigation labeling" and "drop downs" may have addressed the same basic point. Two people explicitly stated that there were no effective or intuitive aspects.
The final part of the study was the System Usability Scale (SUS), which consists of ten rating scales. A single SUS score is calculated for each participant by combining the ratings on the ten scales such that the best possible score is 100 and the worst possible score is 0. In essence, a SUS score can be thought of as a percentage of the maximum possible score.
The mean SUS score was 76% for the Obama site and 45% for the McCain site, as shown here:
The difference was highly significant (p<.0001). Additional insight into the SUS scores can be gained from examining the frequency distribution of the SUS scores for the individual participants, as shown here:
This makes clear the concentration of SUS scores at the high end for the Obama site and toward the middle for the McCain site.
One way of getting an overall sense of the results of the usability study for the two sites is to convert the scores for the primary metrics to percentages and then average them. This can be thought of as an overall usability index. Specifically, the scores combined were task success, task time, and SUS scores. Task success and SUS scores are already percentages, so no conversion was needed for them. Task times were converted by first calculating the average time per task for each participant. The minimum of those average times was then divided by the time obtained for each participant to yield a percentage. (Using this technique, the participant with the fastest average time gets a time score of 100%, while the participant with the slowest average time gets the lowest percentage-- 14% in this study.) The three percentages for each participant (success, time, and SUS) are then averaged together.
The means of these scores for each of the sites are illustrated here:
The overall average for the users of the Obama site was 67%, while the overall average for the users of the McCain site was 43%. This difference was highly significant (p<.0001).
It was a landslide usability victory for the Obama site. On almost every usability metric captured, the Obama site came out better than the McCain site. The one task where users were more effective on the McCain was finding a photo of the candidate waving. But the other three tasks came out better on the Obama site.
Several usability issues with both sites were apparent from the study:
Was this a perfect study? Absolutely not. But it was a quick one that did yield some insights into the usability of both sites. If I had wanted to take a little more time preparing for the study and collecting the data, some of the things I would have done differently include:
Maybe the next time we have a presidential election, we can just do a usability study of the candidates' websites to see who's going to win!
Comments? Contact Tom@MeasuringUX.com.